
Raspberry Pi and IMU sensors
We return to the Raspberry Pi and we are going to see how to add additional sensors to it. Specifically, we are going to add an IMU, which connected by I2C and for less than 4 euros, will allow us to control aspects of our boat such as heel, trim or heading.
This is the basis to be able to build an autopilot for our boat, but also to optimize performance, speed and fuel consumption. We will learn about the concepts of heel and trim and how these influence performance, and we will make a small diagram with NodeRED to be able to monitor these factors and find the optimal performance point for our boat. All here at: The Low Cost Sailor
Some videos that may be useful for you to review:
✅ EP11 – The One with the Raspberry https://youtu.be/oqOyNPMbu5o
✅ EP22 – The one with the WiFi switch panel https://youtu.be/gdB2Zn-vVw0
✅ EP48 – The one with the old laptop https://youtu.be/N6zsLNhyhv8
✅ EP51 – The introduction to Node-RED https://youtu.be/BVBYoBYRZNs
Necessary material that appears in this video:
✅ The famous IMU
🔶 On AliExpress €4:
🔵 https://s.click.aliexpress.com/e/_Dk7BpTb
🔶 On Amazon €10:
🔵 https://amzn.to/3I3MqY4
✅ The analogue version to measure heeling
🔶 On AliExpress €4:
🔵 https://s.click.aliexpress.com/e/_DkQC4PB
🔶 On Amazon €6:
🔵 https://amzn.to/49cQSzs
✅ A very cheap level, in case you don’t want to complicate things so much, like the one I use to see if the boat is straight, or even with the laser to check that the mast is straight..
🔶 On AliExpress:
🔵 https://s.click.aliexpress.com/e/_DEAL1k5
🔶 On Amazon:
🔵 https://amzn.to/3OLs6y8
✅ Raspberry Pi
🔶 On AliExpress:
🔵 https://s.click.aliexpress.com/e/_Dd5Wuj7
🔶 On Amazon:
🔵 https://amzn.to/3T0dzBj
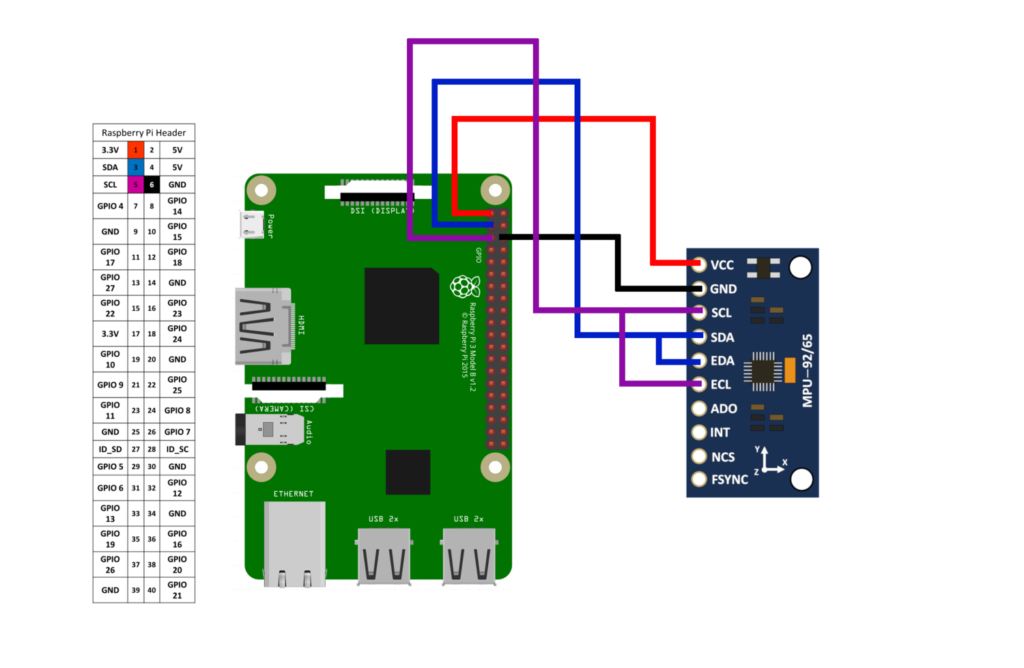
As for the important information, here is the connection diagram, it varies slightly from what I tell in the video:
To exploit the data, here are some examples of schemas in node RED, which you can also import:
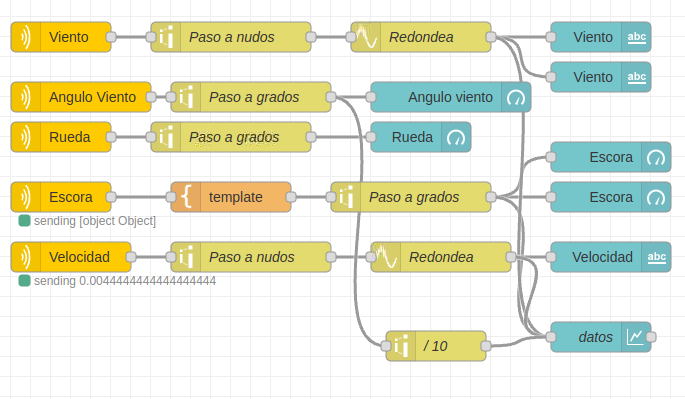
I leave you the diagram with which you can obtain this in Node RED here.
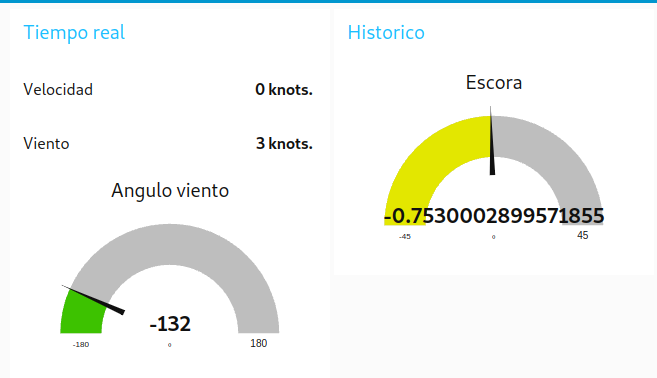
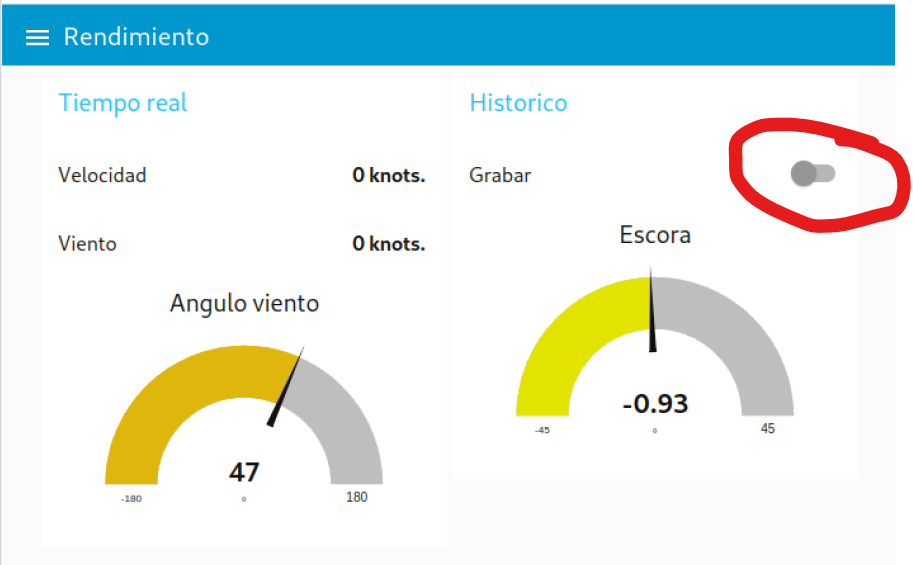
This is the simple version that shows all the data on the dashboard, but as a gift, I show you the diagram that also allows you to save all the data in a CSV to be able to analyze it later, that is, it turns the raspberry pi into a datalogger.
Basically, I add a switch to the dashboard that allows you to activate or deactivate the recording of data to CSV. It gathers all the interesting signalK data, synchronizes it and saves its values every 5 seconds in the CSV file in the documents folder of your raspberry. You can later open this file with Excel or Google Sheets to analyze all the data from your navigations.
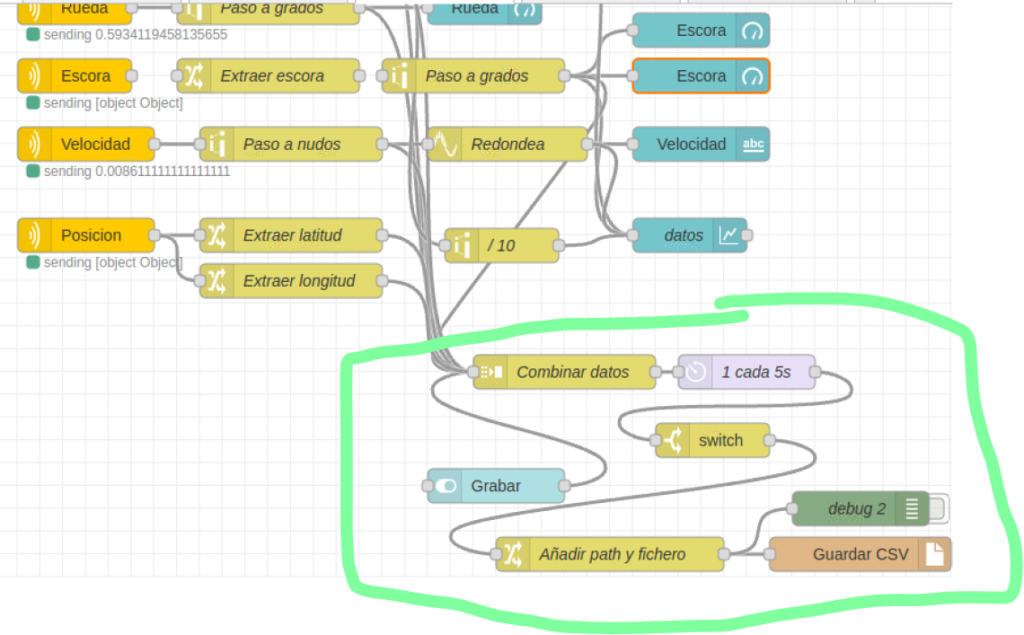
You can download the complete flow for this option here.